gordo
Well-known member
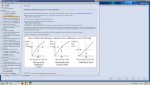
I'm trying to understand the contents of this dialog box. I don't know what workflow it is:

I'm told that Nominal% and Process% are the tone values on the CtP plate. That sounds silly - why have two columns differently named containing the same data? If you recognize the workflow perhaps you can clarify what's going on?
I'm told that Measured% is the tone value measure on the press sheet.
Unfortunately because the Measured% is not tied to the requested tone value I can't correlate the dot gains between separations (which is what I'd like to do) since the .Nominal% and Process% values are different from plate to plate and they have different quantities of values (e.g. Cyan has 12 values but Magenta and Black have 14, and Yellow has 16 in those columns).
Last edited: