A book printer supplied overall dot gain figures for a b/w job that will print on coated stock as follows:
1%-1.3
3%-3.1
5%-5.2
10%-10.3
20%-20.6
25%-25.7
30%-30.9
40%-41.2
50%-51.5
60%-61.8
70%-72.1
75%-77.3
80%-82.4
90%-92.7
95%-97.8
97%-99.9
99%-100
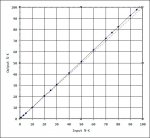
Note how the TVI increases continuously throughout the range, forming a straight line rather than a curved section when plotted as a traditional dot gain chart (see attached jpeg).
The printer confirms that 50%-K and 75%-K patches in a supplied pdf will indeed show up on the press sheet as 51.5% and 77.3%.
Is this believable? If so, any idea why a printer would want to set up their processes to get an overall linear tonal response?
1%-1.3
3%-3.1
5%-5.2
10%-10.3
20%-20.6
25%-25.7
30%-30.9
40%-41.2
50%-51.5
60%-61.8
70%-72.1
75%-77.3
80%-82.4
90%-92.7
95%-97.8
97%-99.9
99%-100
Note how the TVI increases continuously throughout the range, forming a straight line rather than a curved section when plotted as a traditional dot gain chart (see attached jpeg).
The printer confirms that 50%-K and 75%-K patches in a supplied pdf will indeed show up on the press sheet as 51.5% and 77.3%.
Is this believable? If so, any idea why a printer would want to set up their processes to get an overall linear tonal response?
Attachments
Last edited:
")