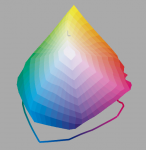
Measured my first output profile - but is it correct?

donster

Active member
Hi all,
so I have tried to measure my first output profile for our Xerox Versant 180 printer (with EFI Fiery, Color Profiler Suite 4.5 and ES-2000 and Command Workstation 6). I am not 100% sure that the result I achieved is actually correct or the best possible. Let me explain my procedure:

1) in CWS I created new calibration settings for Coated 300 (with printer screen mode set to 200 dot as that is what we use for all our jobs).
2) CWS then printed 3 copies of the calibration targets (51 unsorted) on 300 gsm Expression gloss paper
3) took the 3rd copy and measured it with ES-2000
4) then I let the CPS to print out the patches for the output profile (M0 measurement mode, Patch layout 4028)
5) after measuring all the patches, I let it create the new output profile without modifying any of the settings

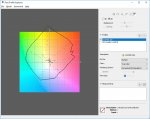
If I print with this output profile, the results are generally OK. Maybe a little bit of magenta tint in photos. But when I inspect the profile and see the gamut - I see some strange things happening in the magenta area - look at the attached picture. Why is this happening and should that make me worried? Or is it normal and I should be calm?

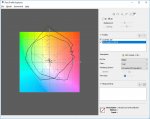
Also, if I add for example ISO COATED V2 to the comparison (see second attached picture), it's gamut is mostly smaller than the one of my profile - which I guess is OK (just confirms that digital print has wider gamut than offset?) Except for the "bottom right" corner of the gamut - there the ISO COATED V2 profile is much wider in gamut. Is this a problem? How would it show in regular prints like photos or flyers? And if this is a problem - why is it happening and what do I do to fix it?

Thanks for any input.
 

Attachments

  • photo7312.jpg
    photo7312.jpg
    94 KB · Views: 387
  • photo7313.jpg
    photo7313.jpg
    100.7 KB · Views: 367
For sure something is wrong with that profile, but I'm also not 100% sure what Fiery is reporting in those screenshots.

1.) It shows plot as surface as the selected option but it looks to only be plotting CMYK+RGB linearization.
2.) The stock Coated v2 profile also looks incorrect, what is up with the yellow?
3.) Can you export an ICC and upload it?
 
In addition to what arossetti wrote, I'd love to see the measurement data (.it8 file) of both the calibration and the profile steps.

If you are going to try profiling again anyway, I'd suggest against the 4028 patches target - I got some strange results with it. Maybe the patch distribution is not optimal. Try using the standard IT8.7/4 (1617 patches) target.
 
I'd suggest against the 4028 patches target - I got some strange results with it.

I am curious. Can you say what the strange results were, when using the higher number of targets?

Thanks
 
Well, maybe strange is not the right word for it. I got high delta-E values in the round-trip transformations, and uneven areas in the Granger rainbow image, compared to the IT8 target. I haven't done any thorough investigation, so it might have been a local problem. My suggestion to donster is to use a standard, well known target, to remove any variables in that area.
 
arossetti:
1) To be honest, I don't really know what that means...
2) it indeed looks strange, but that is the widely used source profile, nothing that I would (or could) measure/influence I think? Basically it's like Fogra.
3) ICC attached. I would also attach the .it8 file, but I'm not sure I got that saved somewhere (certainly it did not ask me to save it anywhere).

However, I remember that after the measurements, the average delta E was 1.8, but maximum measured variation was 41.4 - which could be part of the problem. But what does it mean? Did I measure it wrong? There's not much you can do differently when measuring the patches...So was it printed wrong? Does that mean the printer has a problem?
 

Attachments

  • COATED 300.zip
    2.1 MB · Views: 355
So donster to answer your question, NO this is not correct and why you have these results I have no idea. I would only be alarmed by these results if you try to build another profile and they return something similar.

A few things to mention though since this is your first profile are:

To start, get with your tech to make sure that any parts are not at end of life and if so replace them. Run some test prints on the stock you plan to profile. What I mean by this is I created test prints which are floods on 11x17 that are broken into 100/50/15 of each color, hence 12 shts total. No real science to the chosen screens but what I look for is holes, banding, etc. to make sure that the media runs well before I start building a profile.

Next when you go to begin building your profile choose 51 Randomized and measure at M0.

I assume you are bypassing G7 therefore when you get to setting up your patches choose 1485 Randomized and select M0 or M1 up to you.

When measuring you need to be VERY careful you DO NOT allow the device to rock while measureing. Also watch to make sure you don't get any bad reads which are obvious. The entire row you just measured will return some other colors. If it does, reselect row and remeasure.

After measuring take note of your deltas. In a nutshell for coated you should get something like .5 AVG and 1.1 or something MAX delta. Numbers can vary so don't get hung up on those but gives you an idea this is what mine were so gives you a ballpark.

When you get to the black generation pop-up screen and this is important, at the top there is a drop down. You need to make sure you select the "Factory" profile that best resembles the paper type you are measured. It most likely will have the name you named the profile then .tmp following. Again assign the factory profile.

Leave GCR settings for now and tick the optimize button and choose lighting D50.

Hopefully that helps a little and good luck!

BTW your deltas you reported are not even remotely realistic so yeah that is a bad profile for sure!
 
Donster:

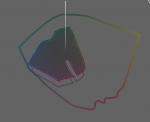
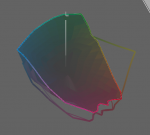
The way Fiery displays that 2D gamut viewer has something funky going on however I was able to look at your ICC profile. Looks like you just had some bad measurements especially in the reds. I would just recreate it and if you didn't before randomize the IT8 patches when you print.

In that first image that big gap is probably your DeltaE of 40. Second image has a similar issue. You also have a green measurement that is off that I don't think I showed in these pictures.

This looks like a measurement issue or a smudge on a print but not an issue with the printer.
 

Attachments

  • Screen Shot 2018-02-06 at 11.13.00 AM.png
    Screen Shot 2018-02-06 at 11.13.00 AM.png
    31.2 KB · Views: 308
  • Screen Shot 2018-02-06 at 11.13.21 AM.png
    Screen Shot 2018-02-06 at 11.13.21 AM.png
    43.8 KB · Views: 335
  • Screen Shot 2018-02-06 at 11.14.23 AM.png
    Screen Shot 2018-02-06 at 11.14.23 AM.png
    33.9 KB · Views: 335
Last edited:
So many people seemed to be confused about the proper about the proper procedure to create calibration and profiles with FCP. This is probably the best explanation I have yet found. #5
 
Thanks guys. I will try to measure the profile again. Unfortunately I am a little busy these days to play with the printer, but once I get to it, I will let you know my results.
 

PressWise

A 30-day Fix for Managed Chaos

As any print professional knows, printing can be managed chaos. Software that solves multiple problems and provides measurable and monetizable value has a direct impact on the bottom-line.

“We reduced order entry costs by about 40%.” Significant savings in a shop that turns about 500 jobs a month.


Learn how…….

   
Back
Top