Need some help from G7 folks...

gordo

Well-known member
I know this is "old school" however I would like to have the TVI data from a G7 certified (or ISO 12647 compliant) press sheet. Or you can give me the data file that I can extract the info from using ColorAnt.

I'm trying to make sense of the press gain curves from a G7 certified shop.

I can read a file with this header (and maybe others):

ORIGINATOR "i1Profiler - X-Rite, Inc."
INSTRUMENTATION "i1iO 2 ; Serial number 27248"
DESCRIPTOR "XTC_24_TestChart_Measurement_M1"
MEASUREMENT_SOURCE "MeasurementCondition=M1 Filter=D50"
ILLUMINATION_NAME "D50"
OBSERVER_ANGLE "2"
FILTER "D50"
WEIGHTING_FUNCTION "ILLUMINANT, D50"
WEIGHTING_FUNCTION "OBSERVER, 2 degree"
KEYWORD "DEVCALSTD"
DEVCALSTD "XRGA"
CREATED "2015-07-29T17:32:01"

When I look at these press TVI curves:
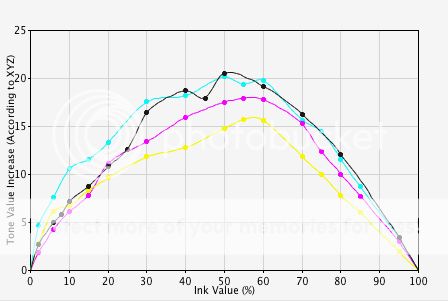
TVIs%20graphed_zps0ui7dq0n.jpg


or this:

TVIs%20graphed%202_zpsb9xnpgvh.jpg


...they look like a disaster. So I would like to see what other certified G7 press sheet curves look like to compare the difference.

Comments are also appreciated.
 
Last edited:
I know this is "old school" however I would like to have the TVI data from a G7 certified (or ISO 12647 compliant) press sheet. Or you can give me the data file that I can extract the info from using ColorAnt.

I'm trying to make sense of the press gain curves from a G7 certified shop.


When I look at these press TVI curves:
TVIs%20graphed_zps0ui7dq0n.jpg


or this:

TVIs%20graphed%202_zpsb9xnpgvh.jpg


...they look like a disaster. So I would like to see what other certified G7 press sheet curves look like to compare the difference.

Comments are also appreciated.

Why do you say they look like a disaster? Maybe they are what they are.

From looking at the curves, it seems that the curves are smoother above 60% and are more variable below that value. Could it be just random variation in the dot gain in the lower range? I would not expect that dot gains are always consistent because the ink films that are applied to the plate can vary depending on the image that is being printed. The image in the plate will affect the ink films left on the form rollers after contact, which then will not totally be reinked evenly by the other rollers in the roller train. This results in an uneven inking of the plate and would result in variation of dot gain in a screened area.

This variation of the inking of the plate can be periodic and also random. So I would expect some variation in dot gain from impression to impression. The other possibilities are variation due to doubling from various causes, such as paper movement or some mechanical issues.

You might also have issues with the measurement device. An "old school" densitometer might have less variation of dot size measurement due to its physical filter than there might be with a spectrophotometer, which is calculating its values from a set of fairly coarse zones across the spectrum. If you remember calculus in high school, the accuracy of an integral, as in the area under a curve, got better when the zone width approached zero. Low cost spectrophotometers used in the graphic arts tend to have a relatively low number of zones, where a high number of zones is needed for high accuracy.

Also as an observation, I thought with G7, the black curve should be higher than the rest of the curves. Not sure about that.
 
I'm going to make some leaps... Either the G7 consultant who submitted to IDEAlliance on these was either tired of fighting the printer or doesn't really give a damn and did what it took to get a good sheet for IDEAlliance to approve. If the equipment and/or operators aren't up to the task remedial measures need to be taken. There's a reason PressSync curves exist and that is to prevent this kind of crap.

Edit: This (Esko.com) explains the idea of PressSync.
 
Last edited:
Why do you say they look like a disaster? Maybe they are what they are.

Halftone screens are typically bilaterally symmetrical. Basically the dots from 0% to 50% are the same as the ones from 50% to 100%. Just that the ones from 50% to 100% are inverted. Therefore the TVI curves should reflect that symmetry. If they don't then that might indicate a problem.
Typically the tone values on the plates are the same for all 4 colors (e.g. the linear film days). Therefore the curves should all have the same basic shape.
Typically the inks are run at different solid ink densities (Y lowest, C & M similar, K highest). Therefore the TVIs would reflect the SID differences with Y being the lowest, C and M being similar and K the highest.

The curves I posted are from two separate dedicated characterization press runs - not live production work.

When I see curves that are not bilaterally symmetrical, nor having the same shapes, nor reflecting the SID differences (as in the ones I posted) then that suggests to me that either there are ink/press issues or that plate curves are being used to try and compensate for ink/press issues.

Are there no G7 folks on this forum?
 
The curves I posted are from two separate dedicated characterization press runs - not live production work.

[/SIZE]

Just a thought. If this was from a characterization run for G7, would it not be that the aim of the run was to gain a smooth CMY gray curve, by changing dot data values, for the combined print of CMY and related K. In that situation, the dot gains curves might not be smooth as one might expect since the intension was to get the smooth gray curve, with its overprints etc.

Maybe this is totally not related to the data you have. It was just a thought.

As they say - anything is possible but not everything is probable.

The printer is supposedly G7. The characterization run was for a completely different purpose.

I'm hoping to see data from a G7 printer to help me better understand these curves. But so far no response. :-(
 

PressWise

A 30-day Fix for Managed Chaos

As any print professional knows, printing can be managed chaos. Software that solves multiple problems and provides measurable and monetizable value has a direct impact on the bottom-line.

“We reduced order entry costs by about 40%.” Significant savings in a shop that turns about 500 jobs a month.


Learn how…….

   
Back
Top