cmcfarling
Active member
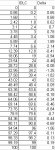
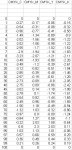
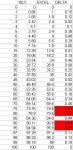
I've attached an Excel doc that I've been working on that will calculate G7 curves. Before proceeding I'd like to verify that it produces accurate results. Currently the only way to generate G7 curves is to use the expensive ($1200) IDEALink Curve software or the cumbersome (but cheap) fan graph paper, plotting everything manually. I assume this Excel doc would be more accurate that the fan graph paper but less accurate than the Curve software. I'm wondering if someone that has access to the Curve software could run this sample data set through it for comparison.
Currently this will only calculate CMY RIP curves. In addition the max neutral density has to be between 1.28 - 1.56. Attached is a sample data set consisting of neutral density values from column 5 of a P2P target (CMY column). Also included in that file are the calculated RIP curve data points based on a target curve with a max neutral density of 1.28. I'm curious to see how close these are to the RIP curves generated by the Curve software.
If all is well I intend to post the final version here.
Chris McFarling