Can someone explain the ISO chart

gordo

Well-known member
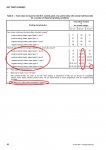
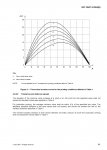
Can someone explain the ISO 12467-2 dot gain chart?
ISOgraph.jpg


What I'm looking for is what print conditions to the letters A-H stand for. They don't seem to be described anywhere in the document.

Also, are these target dot gains - i.e. for print condition "H" whatever that is, I should get 34% dot gain?

thx, gordon p
 
I think you will find them from fogra.
I'll see if i can dig it up.
A is the curve for CMY for Coated positive plate (ISO Coated v2 and FOGRA 27, FOGRA 39 etc)
B id curve for K for same as above

B is also curve for CMY for Web (paper type 3)
C is curve for K for uncoated (they actually claim that this is the way it turns out with linear plates ;p)

For paper type 4/5 (uncoated and uncoated yellowish)
C is curve for CMY
D is curve for K

Now in the original ISO spec they make a difference for pos (and CTP) and neg process.
I think H was neg film on newsprint or something like that. The idea to have a different curve for different process is so counterproductive to standardisation and is more a statement if you use linear film or plate and a possitive or negative plate this is what you get. May be flexo is on one of those curves I'll have to digg out some old documents before I can give a better answer.
E, F, G and H in "my world" are outdated/redundant ;p
 
:) Ok here is some more info

:) Ok here is some more info

The dotgain curves are not only dependant on process put screen. This due to a linear-plate-and-letts-see-what-we-get approach to standardisation rathen than looking at the paper.

Screen is classified as 52, 60 and 70 lines per centimitre.
Annex B (informative) describes the TVI and Screen dependancy, this as you may have gathered from my other posts i find counter productive to standardisation. A client will not know or care what screen you use if you use neg or pos plates they just want to know what shade of gray a 50% will be (though they don't know that is what they want)

I do not habve the H curve in my document wich is the ISO 12647-2:2004 (E)
 
The pages from ISO 12647-2 (pg. 19 & 20). In page 19, which indicated the curve representing which type of paper and plate.
Remark (c) stated the definition of curve for CTP plate
From pg. 20 of ISO 12647-2, did not found the curve G & H.
 

Attachments

  • Pages 19 from ISO 12647-2-2004.jpg
    Pages 19 from ISO 12647-2-2004.jpg
    94.9 KB · Views: 360
  • Pages 20 from ISO 12647-2-2004.11.15.jpg
    Pages 20 from ISO 12647-2-2004.11.15.jpg
    192.3 KB · Views: 437
The pages from ISO 12647-2 (pg. 19 & 20). In page 19, which indicated the curve representing which type of paper and plate.
Remark (c) stated the definition of curve for CTP plate
From pg. 20 of ISO 12647-2, did not found the curve G & H.

Thanks for that. The chart in my copy of the ISO does not have the letters that yours does. Interesting also that, in the section above the one you circled, they do not include and letter codes. So there does not appear to be curves for "Four-colour continuous forms printing, chromatic colours" whatever that is.

I think that it is bizarre that this document, that has been around for so many years remains very unclear. I'm also surprised that they seem to be reporting what the dot gains are based on a linear film imaged plate workflow, rather than establishing common tone reproduction targets. An ISO expert once told me that you cannot use FM screening for publication work because the dot gains would be so high that they'd be "off the chart". I gues he never heard of CtP dot gain compensation curves.

thanks again, gordon p
 
Last edited:
The info I supplied was that wich i managed to get from FOGRA about CMY being one curve and K the one above. Took me a long time to get that info, and I find that information more practical than the generic table which is more of a statement than a guide.
 
@ Lukas,

A clear case of creating standards and specifications documents that seem designed more to confuse that to educate. One wonders if the people that write these things ever try to read them. :-(

best, gordon p
 
hey Gordo. What verion of ISO12647-2 do you have there. I have the ISO12647-2:2004 & ISO 12647-2:2004/Amd 1:2007, which I thought were the current versions and I only show curves A-F.
 
hey Gordo. What verion of ISO12647-2 do you have there. I have the ISO12647-2:2004 & ISO 12647-2:2004/Amd 1:2007, which I thought were the current versions and I only show curves A-F.

My copy, like me, is very old - 1996.

What prompted my question was a PDF published by AIDO (aido expertos en tecnología para la empresa) in 2007. AIDO is a technical institute is Spain, highly regarded as top experts in Graphic Arts. It contains the same graph just A-F without any explanation as to what A-F represents. Do your versions contain explanations?

best, gordon p
 
Go get them Gordo! I'll be waiting for the RE: print with the curve being explained ;)
Maybe they have the answer in Printistan?
 
We do a web test a month ago,and the dot gain can`t maintain 18%,usually 20%-22% is normal.Actually our machine only use 1 year,totally a new press,so I doubt the standard in web part should be improved~
 
@Bloodsaler

Compensate it in the plate. For paper type 3 (positive), follow curve B for CMY, and curve C for black. You will get nearer if you follow all the required parameters and materials. If you can't follow religiously the requirements, then do not follow the standard and create your own internally.

Just my thought.
 
We do a web test a month ago,and the dot gain can`t maintain 18%,usually 20%-22% is normal.Actually our machine only use 1 year,totally a new press,so I doubt the standard in web part should be improved~

Actually, there is a big problem that what displays on your X-RITE measurement device such as 528 is not the truth! For example, you get TVI 22% maybe not the actually physical status of the production. So, 528 advise the user to change the Nelson Factor for getting the reasonable result.

So, don’t believe the measurement device anytime!
 
@savomax
If we cannot believe the measuring device how do we measure? We use a number of measuring devices and check them against each other.
In some applications (eg Apogee) I also see using density to create the TVI curve as an alternative.
 
Hi Lukas, You are right.
But I mean that We should setting the Nelson factor to make sure what we measure is reasonable. Some times I found the result from the device such as 528 was wrong, because I can check the dot TVI with the magnifier. Especially, we almost can’t use the 528 to estimate the 1%-10% area’s TVI. The 528 gets the result with calculating the conjunction of the 1%-10% tint’s density and the solid density, but there maybe a big deviation when it measure the little tint area which should be influenced by the paper. This situation is similar to the weight measurement of something, if it’s lighter, it will be more difficult to get the actual weight. So, if we want to get the actual TVI, we must set the Nelson factor according to the different screen line and different paper material, it’s not a straightforward issue.
 
We not use 528,we use Spectroeye Densitimeter~And the Nelson factor is to hard to normal man to calculate~It`s a difficult math work~
 
@savomax

We usually measure TVI starting at 5%. From 1%-4%, we just use magnifying glass.
 

PressWise

A 30-day Fix for Managed Chaos

As any print professional knows, printing can be managed chaos. Software that solves multiple problems and provides measurable and monetizable value has a direct impact on the bottom-line.

“We reduced order entry costs by about 40%.” Significant savings in a shop that turns about 500 jobs a month.


Learn how…….

   
Back
Top