How exactly dot gain tests are performed and how results are interpreted

bebris

Member
Hello printing experts,

I'm trying to make a dot gain compensation curve. But I'm not sure if I do it right.
Doubts are about print stability and method of gaining right data.

I have made a dot gain test on a SM102-4 printing press for particular paper and ink combination.
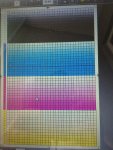
A test sheet have six dot gain control strips in two rows: one in the bottom (griper side) and one row on top and in each row there is one control strip in the middle and one in each corner. See preview:

test_sheet.jpg

1. Is it OK to have so much control strips all over the sheet?
2. Do you measure dot gain in corners or just in the middle of sheet?
3. How much sheets do you print? I've printed 1000.
4. How much sheets do you measure? How much measurements do you take?
5. Do you measure sheets in a row (and looking for anomalies) or do you measure every 100th (or 50th) sheet? I've measured every 100th and 10 sheets in a row.
6. What is allowed spread (delta) of dot gain measurements from one sheet? I have measured 11.3@40% in bottom middle and 16.4@40% in top left corner. Difference is more than 5. Is it OK? If not OK, how much would be OK?
7. What is allowed spread (delta) of dot gain measurements between sheets? Sometime measurements from one sheet to other differ in about 5-8%. I think that this is to much and that makes me think that printing was not stable.

I can share my measurements if you ask.

Thanks in advance!
regards
bebris
 
Hello printing experts,

I'm trying to make a dot gain compensation curve. But I'm not sure if I do it right.
Doubts are about print stability and method of gaining right data.

I have made a dot gain test on a SM102-4 printing press for particular paper and ink combination.
A test sheet have six dot gain control strips in two rows: one in the bottom (griper side) and one row on top and in each row there is one control strip in the middle and one in each corner. See preview:


1. Is it OK to have so much control strips all over the sheet?
2. Do you measure dot gain in corners or just in the middle of sheet?
3. How much sheets do you print? I've printed 1000.
4. How much sheets do you measure? How much measurements do you take?
5. Do you measure sheets in a row (and looking for anomalies) or do you measure every 100th (or 50th) sheet? I've measured every 100th and 10 sheets in a row.
6. What is allowed spread (delta) of dot gain measurements from one sheet? I have measured 11.3@40% in bottom middle and 16.4@40% in top left corner. Difference is more than 5. Is it OK? If not OK, how much would be OK?
7. What is allowed spread (delta) of dot gain measurements between sheets? Sometime measurements from one sheet to other differ in about 5-8%. I think that this is to much and that makes me think that printing was not stable.

I can share my measurements if you ask.

Thanks in advance!
regards
bebris


This post shows how to build the curves once you have the data: http://the-print-guide.blogspot.ca/2010/02/principle-of-dot-gain-compensation.html

1. Yes - but it's not a good idea to include pretty pictures, especially if they're inline with the test targets. If you want pretty pictures then group them together and keep separate from the test targets.
2. You need to make sure that the ink is evenly laid across the sheet. That is the solid CMYK bars are for. They should be positioned along the lead and tail edge of the sheet and inline with the sheet direction at left, center, and right. you measure the solid ink densities of those bars. There shouldn't be more than a 0.05 variation. Then it doesn't matter where you measure dot gain.
3. Printing 1000 should be enough.
4/5 Measuring every 100th sheet should be enough to average out the readings.
6. There should be very little variation in dot gain in one sheet if you've done #2 correctly. You've measured 11.3@40% in bottom middle and 16.4@40% in top left corner and that difference is too much.
7. A press is stable but not consistent. If you run many more than 1000 sheets you'll see that ( http://the-print-guide.blogspot.ca/2011/10/on-press-stability-and-consistency.html ). Measure the solid colors for the ten sheets out of the run to check for consistency.
 
Can I ask a couple newbie type questions?
1. What is the purpose of this test?
2. What is used to measure the dot gain? Is it visual or is there a tool or something?
 
1 to determine the current press dot gain - and if required build tone reproduction curves to apply to the plates to bring press tone reproduction to a standard.
2 a densitometer is used to measure the dot gain
 
1 to determine the current press dot gain - and if required build tone reproduction curves to apply to the plates to bring press tone reproduction to a standard.
2 a densitometer is used to measure the dot gain


Going through this process can also give you information about the current press condition. For, example, plotting the native dot gain curves (i.e. no dot gain compensation curves applied) like this:
Bad%20Curves_zps38k1xhbe.jpg

Tells you that, in this particular case, there are press issues that need to be fixed before curves are created.

You can also plot average densities across the sheet like this:
Avg%20Density_zpsbzzxpo3g.jpg


And if you're really enthusiastic you can plot many press sheets and sheet the "heartbeat" of the press - its cyclical variation:
Averaged_zpswsjmp8rd.jpg


Doing these sorts of exercises can reveal a great deal about what's going on on the press.
 
Hi gordo,
Thank you for answers!

1. Yes - but it's not a good idea to include pretty pictures, especially if they're inline with the test targets.
What would be the look of your test sheet layout? What would you print in the background?

You've measured 11.3@40% in bottom middle and 16.4@40% in top left corner and that difference is too much.
How big difference would be acceptable in your opinion?

And regarding your post http://the-print-guide.blogspot.ca/2011/10/on-press-stability-and-consistency.html
There is a video of dot gain measurements. Can I ask what type of press and paper was used and what type of job was printed? As I noticed dot gain of black color @50% was changing from 11 till 25. Quite big variation...

Thank you once more!
regards
bebris
 
Hi gordo,
Thank you for answers!


What would be the look of your test sheet layout? What would you print in the background?

The attached layout has worked well.


How big difference would be acceptable in your opinion?

<2%

And regarding your post http://the-print-guide.blogspot.ca/2...nsistency.html
There is a video of dot gain measurements. Can I ask what type of press and paper was used and what type of job was printed? As I noticed dot gain of black color @50% was changing from 11 till 25. Quite big variation...

The video was created from reports created by software that does real-time press sheet analysis. It's sheetfed offset but the vendor just gave me the data years ago to illustrate the issue so I don't know what paper or press the data came from. The jumps in variation could result from many causes - e.g. initial start up/make ready, press stop/restart etc.
 
ISO 12647-2 stipulates a Midtone Spread tolerance of 5%. It is more realistic.
In the our case it is unreal to expect of constant dot gain across the sheet with densities evenly laid across the sheet because of uneven wear of blankets. The center of blankets tends to be weared more than at corners due to sheet sizes.
We do the averaging of dot gain in the right, the left and the center for dry (very important !) 10-15 sheets.


Finally, I stopped this messy job by purchasing the combination of reliable tools.
pressSIGN + Techkon SpectroDrive.

http://www.presssign.com/newsdesk_in...7de99ee6d650f4
http://www.techkonusa.com/products-2...trophotometer/


Now, I'm getting thousands of various digits from the pressroom by just sitting in my office. We do not print thousands of test sheets anymore because each measured real job sheet provides me with consistency of densities, Lab of Primaries, Lab of Secondaries, trapping, gray balance, dot gain, Lab of paper and a lot of graphs.
 
Last edited:
Dear Saulius, I also make tonal calibration and only solid plus % dots (2,5,10,20,30,40,50,60,70,80,90,95,98).
You make press run to get its normal condition,then adjust ink levels as maxium on left and min on the right,be sure that the water level is just above cleaning the plate, then print about 100-200 sheets,then stop and select randomly about 10 sheets wait for about at least 3 hours to dry,then select suitable solid densities( y: 1,25-1,30, m:1,40-1,45, c:1,45-1,50, k:1,75-1,85), then measure the dot gains and get average from the 10 sheets for each % and enter into the RIP as corrections then repeat the test and see the results are as you expected or not? While entering the corrections, you should take the 1/3 of the difference ( for example: 40 % should be 53 % and if got 62 % the you should enter as the 1/3 of the 9 % difference, and correct as 37 % to 40 %)

If you mail me then I can send to you pdf of test pages [email protected]

this is the sample of heat set test results before and after the tonal adjustments,you can see their black and yellows were too high dot gains

 
The advantage of a busy test chart with a high ink coverage is that if the density goes too high, there is some good coverage to bring it down fairly quickly, saving you some sheets. I used to place the step wedges at various positions across the sheet, but always running from head to foot and surround them with with images and other test chart artefacts.
 
The advantage of a busy test chart with a high ink coverage is that if the density goes too high, there is some good coverage to bring it down fairly quickly, saving you some sheets. I used to place the step wedges at various positions across the sheet, but always running from head to foot and surround them with with images and other test chart artefacts.


The problem with using images is that they can distract the press operator from the goal of printing to the numbers - i.e. equal solid ink densities/Lab values across the sheet.

Could you explain/clarify your 1/3 of the difference correction? Are you saying that if I have 50% on the plate and get 62% on the presswork but my target is 68% on the presswork that I should take 1/3 of the difference (in this case 4%) and therefore make 50% on the plate equal to 54% instead of 50%?

BTW your attachment didn't work. Also I think there are many people on this forum that would like to see the test form you use so please don't take this thread offline.
 
No Title

Dear Gondo, as you know if you make any correction according to your tonal test it may reflect you too much from the target and in my way you should approach the target step by step each time 1/3 of the dfeerence from actual to desired, in this caseyour presswork target is 68 and you got 62, the difference is 6 what you get actuallly from the target, and that is 2 and make 50 % as 48 %, right?

I am trying to attach the pdf of the test skala but can not?

View attachment test skala.pdf
 

Attachments

  • photo4923.jpg
    photo4923.jpg
    1.3 MB · Views: 471
Dear Gondo, as you know if you make any correction according to your tonal test it may reflect you too much from the target and in my way you should approach the target step by step each time 1/3 of the dfeerence from actual to desired, in this caseyour presswork target is 68 and you got 62, the difference is 6 what you get actuallly from the target, and that is 2 and make 50 % as 48 %, right?

I am trying to attach the pdf of the test skala but can not?


You seem to be saying what you do but not why you feel that this is the was to do it. Could you explain the thinking behind your 1/3 of the difference formula? 1/3 seems arbitrary. Why not 1/2 or 1/4?

In the example - with a 50% dot on plate I get 62% on press but my target is 68% on press.
You're saying that the difference is 6 from my target (68% - 62% = 6%). Annd 1/3 of the difference ( 1/3 of 6) is 2 and so I should make the 50 % on plate into a 48% on plate? Wouldn't making the 50% a 48% lower the dot gain instead of the increase in dot gain to get to my 68% target?

Also, what is the direction of your test form through the press? As on the left or as on the right of this image?

travel%20direction_zpsoajkujtg.jpg


Does your test form cover the entire press sheet or only part of it?

Earlier you wrote "You make press run to get its normal condition,then adjust ink levels as maxium on left and min on the right," does this mean that your solid ink densities are very high on the left side of the press sheet but very low on the right and the densities are at a standard in the center?
 
Last edited:
Dear Gordo, 1/3 is our customer's experience ( I am working as an R&D manager and an ink formulator also as customer Tecnincal Service for an ink manufacturer and joined here to increase my prepress knowledege and also help people from ink side if I can) over years and I also saw that this way is better after many trials of tonal calibration.
The test chart is in vertical direction and if the plate is 70X100 then you can put 2 side by side so that entire plate will be covered. This is the way also followed by X-rite's represantatives here in my country,and it works quite well.
During press run, you should not need to adjust anything just left side maximum and right side minimum ( like by a declining line) and in anywhere on the chart you can get any desired solid density (y:1,25-1,3, m:1,4-1,45,c:14-1,5,k:1,75-1,85) so that not to waste too many papers, for exanple in a newspaper, about 300 sheets were ok in my trial.
As you said on the test charts, ther shoyld not be pictures, and this is very simple, at the bottom solid then 98,95,90,80,70,.......20,10,5,2 ( lower tones,midtones and upper tones all covered) and the operator should be careful during the test, it should be normal printing conditions and the water levels should be just above cleaning ( no dirts should be on the paper otherwise should be repeated since there are lower dots which will be effected)
 
Dear Gordo, 1/3 is our customer's experience ( I am working as an R&D manager and an ink formulator also as customer Tecnincal Service for an ink manufacturer and joined here to increase my prepress knowledege and also help people from ink side if I can) over years and I also saw that this way is better after many trials of tonal calibration.
The test chart is in vertical direction and if the plate is 70X100 then you can put 2 side by side so that entire plate will be covered. This is the way also followed by X-rite's represantatives here in my country,and it works quite well.

Thank you.
 
What would you print in the background?

When creating a characterisation chart for press use, Kodak’s ColorFlow software has an option to use an “even” tint of 40cmy20k for even ink distribution (don’t know why not 40cmyk). This is NOT for grey balance and the press operator should be informed to ignore the background tint and that it is intended to reproduce warm, not neutral.


Stephen Marsh
 
(don’t know why not 40cmyk).

Probably because the back ground would print too dark to see issues like rosette drift. (rosette drift can alter the tonality and hue of patches on a characterization test form).
 
Last edited:

PressWise

A 30-day Fix for Managed Chaos

As any print professional knows, printing can be managed chaos. Software that solves multiple problems and provides measurable and monetizable value has a direct impact on the bottom-line.

“We reduced order entry costs by about 40%.” Significant savings in a shop that turns about 500 jobs a month.


Learn how…….

   
Back
Top