
Hello printing experts,
I'm trying to make a dot gain compensation curve. But I'm not sure if I do it right.
Doubts are about print stability and method of gaining right data.
I have made a dot gain test on a SM102-4 printing press for particular paper and ink combination.
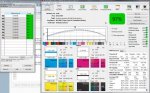
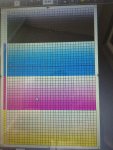
A test sheet have six dot gain control strips in two rows: one in the bottom (griper side) and one row on top and in each row there is one control strip in the middle and one in each corner. See preview:

1. Is it OK to have so much control strips all over the sheet?
2. Do you measure dot gain in corners or just in the middle of sheet?
3. How much sheets do you print? I've printed 1000.
4. How much sheets do you measure? How much measurements do you take?
5. Do you measure sheets in a row (and looking for anomalies) or do you measure every 100th (or 50th) sheet? I've measured every 100th and 10 sheets in a row.
6. What is allowed spread (delta) of dot gain measurements from one sheet? I have measured 11.3@40% in bottom middle and 16.4@40% in top left corner. Difference is more than 5. Is it OK? If not OK, how much would be OK?
7. What is allowed spread (delta) of dot gain measurements between sheets? Sometime measurements from one sheet to other differ in about 5-8%. I think that this is to much and that makes me think that printing was not stable.
I can share my measurements if you ask.
Thanks in advance!
regards
bebris
I'm trying to make a dot gain compensation curve. But I'm not sure if I do it right.
Doubts are about print stability and method of gaining right data.
I have made a dot gain test on a SM102-4 printing press for particular paper and ink combination.
A test sheet have six dot gain control strips in two rows: one in the bottom (griper side) and one row on top and in each row there is one control strip in the middle and one in each corner. See preview:
1. Is it OK to have so much control strips all over the sheet?
2. Do you measure dot gain in corners or just in the middle of sheet?
3. How much sheets do you print? I've printed 1000.
4. How much sheets do you measure? How much measurements do you take?
5. Do you measure sheets in a row (and looking for anomalies) or do you measure every 100th (or 50th) sheet? I've measured every 100th and 10 sheets in a row.
6. What is allowed spread (delta) of dot gain measurements from one sheet? I have measured 11.3@40% in bottom middle and 16.4@40% in top left corner. Difference is more than 5. Is it OK? If not OK, how much would be OK?
7. What is allowed spread (delta) of dot gain measurements between sheets? Sometime measurements from one sheet to other differ in about 5-8%. I think that this is to much and that makes me think that printing was not stable.
I can share my measurements if you ask.
Thanks in advance!
regards
bebris