You are using an out of date browser. It may not display this or other websites correctly.
You should upgrade or use an alternative browser.
You should upgrade or use an alternative browser.
How to reverse press target Xitron Rip
- Thread starter gosciak
- Start date
Not familiar with Xitron, but why are you using commas (,) instead of (.)?
Also, I think you maybe reading the inverse numbers for the media (take 100 minus your results to flip the curve)
Commas are automatic with the reading test, I not type it, it's from i1 and genlintools.
The results of minus are crazy
100-60 for 10% = 40 % dot gain?! it's something wrong
OK. Again, I'm not familiar with the Xitron system (hopefully someone familiar with it will comment).
Maybe the commas are interpreted as (.), so 60,26 = 60.26? or is a separator for actual vs. desired outcomes?
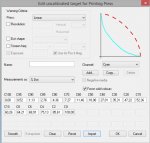
Anyways, this states that it is an uncalibrated target for printing press, so I'm assuming that a wedge is printed and that you are reading the raw (uncalibrated) data to linearize the process?
I'm seeing from the screen shot that at C50 you are reading a 18.08% dot, thus getting a raw negative(-32%) dot gain at C50%, and at C10 you are reading a 60.26% dot? If this is correct, it really looks like adjustments need to be made.
Also, does the cyan curve display change if you alter numbers in your measurement boxes (or is it just a static image)?
Maybe the steps are inversed for the media you are using (so for this case C100=100, C0=0.00, C95=85.61 and C2=0.52, C90=75.13 and C4=1.13....etc...) that would give C50 a number of 47.22. Although that would not mimic the RED line...something like C50=75 would?
The additonal question is how this data is used when plating, do you just use this one curve...or is this to get you linear and then you apply an additional desired curve?
Just found this PDF that talks about stuff and things and the like, might help you.. http://www.xitron.com/downloads/sup..._documentation/Navigator_Configure MinDot.pdf
Last edited:
Thx for any reply, I insert image, on left is my curve mirrored, earlier been in neagtive red line show what I want, something like on right sample SWOP curve  I have CMYK curves for each channel.
I make linearize plate with bump'up for flexo with FAG Flex3Pro, then with this bump up curve make uncalibrated press target, print on press machine, measure i1 with genlintool and i have curves like this, this show me how is dot gain on press, but I must reverse this curve to make job, I put job to RIP and RIP should make dot gain compensation automatically, that after the print on press get what gave me the customer , until now I did it by hand in Photohop or Illustrator/Corel with a ICC press preview manipulating the curve, but this method is not accurate, now I want do it right - is complicated I hope someone help me.
 I have CMYK curves for each channel.
I make linearize plate with bump'up for flexo with FAG Flex3Pro, then with this bump up curve make uncalibrated press target, print on press machine, measure i1 with genlintool and i have curves like this, this show me how is dot gain on press, but I must reverse this curve to make job, I put job to RIP and RIP should make dot gain compensation automatically, that after the print on press get what gave me the customer , until now I did it by hand in Photohop or Illustrator/Corel with a ICC press preview manipulating the curve, but this method is not accurate, now I want do it right - is complicated
Similar threads
- Replies
- 6
- Views
- 1926
- Replies
- 0
- Views
- 1617
- Replies
- 5
- Views
- 1834
- Replies
- 1
- Views
- 2862
PressWise
|
A 30-day Fix for Managed Chaos
As any print professional knows, printing can be managed chaos. Software that solves multiple problems and provides measurable and monetizable value has a direct impact on the bottom-line. “We reduced order entry costs by about 40%.” Significant savings in a shop that turns about 500 jobs a month. Learn how……. |


