TVI in Highlights

Bill W

Well-known member
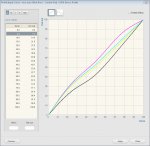
We are running a poly substrate on a flexo press. Raw measurement data analyzed in ColorAnt indicates gain at 2% (1.96% in report) to be 22 - 24%. Press target was IT8.7-4.

After I make a profile, using iProfiler, I check the gain at 2% in ColorThink and it indicates it is around 7%.

When I apply the profile to an IT8.7-4 reference file in ColorThink and then check saved data in ColorAnt it also shows a gain of around 7%.

Using this profile in CGS grossly misrepresents my highlight areas until I built a radical highlight gain curve in CGS.

Help me in understanding why my profile does not match real press TVI.

-Bill-
 
I'm not an expert in the particular software you're using, but one possibility is that ICC profiles for presses commonly use a lookup table and interpolate linearly for the great majority of coordinates. If the lookup table has a resolution of 9, then the data would be interpolated from stored values for 0% and 12.5%. If you have a LUT profile, determine the resolution (LUT size), then compare values at 100 / (resolution - 1)%. If it's much closer, linear interpolation may be the problem. Usually this is compensated for in the profile by input channel curves that change the numbers before moving on to the LUT. It depends on the quality of the algorithms the software uses, and the settings you chose when creating the profile.
 
Bill, when you say you are using your profile in CGS, do you mean this press profile is used for proofing in CGS ORIS ColorTuner?

If so, what is the whitepoint L*a*b* value of the poly substrate and what is the whitepoint L*a*b* value of the proofing media?

Are you using the ICC option when proofing, or the native ORIS DAT colour table option which uses the ICC as a target?


Stephen Marsh
 
Hi Stephen, I am always use the ORIS DAT color table option and proof as absolute. The white point of the profile is L 92, a -1, b 0. However we are presently on a 3 day weekend in the States, I know what a burden to have, and I will not be back in the office until Tuesday so I cannot not supply white point of proof. That said, I have been making proofs using CGS for 5 years or so and have never had to create such a steep proofing highlight bump curve for another other stocks.

I was told yesterday that ICC profiles "bake in" a highlight dot based on offset attributes, not on actual measurements, and the kind of proofing bump curve I built is not uncommon in Flexo when creating proofs for substrates that exhibit very high TVI.
 
Hi Rich

Yes that TVI is possible in flexo depending on the print package. This particular print package is using analog plates on a poly substrate. Ink likes to "spread" on that substrate and analog plates do not hold as small a highlight dot as digital plates do. Labels if designed properly, can still look good even with this compressed tonal range.
 
Hi Bill, I misunderstood the issue. This will not be a substrate white point issue.

As you are using ORIS DAT tables, you should be able to “bump” the highlight data globally. Editing the CC/colour correction file, one can apply a CMYK curve to input colours using the “Action Range” slider. A brute force approach would be to use global gradation curves. CGS ORIS ColorTuner should give you broad or fine control of hitting the measured lab values from press in the proof when using the DAT table option. As you know the colour editing controls do allow one to “tune” the colour.

Kodak Proofing Software Packaging Edition has the ability to create proofing devicelink profiles that simulate traditional flexo conditions using a highlight minimum dot or bump curve that is manually entered (in addition to press measurement data is in CGATS5 format). This could be to overcome the issue you mention with ICC profiles misrepresenting the highlight measurement data. I have not created one this extreme before though!

EDIT: If you can send/make available the ICC and or the CGATS5 data, I would like to see what I can do.


Stephen Marsh
 
Last edited:
Greetings Stephen,

I am aware of and have used the curve tool in CGS to make minor adjustments in the past to the highlight, quarter and mid tone areas.

However this is the most radical curve I have had to build, and this is this most radical highlight TVI from a press run I have experienced.

At the url below you can download a zip file that contains the profile and measurement file used to make the profile. Additionally, there is a PDF file that shows the curves I build in CGS and some highlight number reporting by different software.

-Bill-

https://mpilabels.sharefile.com/d/s3e9b35af69647d08


Hi Bill, thanks for the files.

I have two options to start with here.

Option 1: I created a new profile using Kodak ColorFlow with your CGATS5 data, however it does “smooth” out the highlight end. I can then go in and adjust the input curves or play with the LUT table to overide the input/output values of the profile to account for the flexo minimum dot etc. I have attached a screen capture of the ColorFlow input curves, I would need guidance as to the input/output values that you require. This may or may not be an academic exercise, if the profile has the correct values, when you setup your ORIS queue and perform the colour match to the profile, you should get a match. The bonus is that your profile would also be correct for other uses.

Option 2: With regards to ORIS CTW, the gradation curves are heavy handed tools, I only use them for minor fine tuning if required. I prefer to make custom adjustments to the ORIS colour correction file (.CC), which is basically a proprietary DeviceLink editor, allowing one to specify input and output values and an “action range” to smooth out the adjustments. When I previously mentioned editing the ORIS DAT file, I was specifically meaning making adjustments to the CC data, which can also have gradation curves applied over and above the edited values in the CC file to compound the “selective” .CC edits. Hope this makes sense (I am also using ORIS ColorTuner Web 2.x, which may offer different abilities to your version?). I will get back to you on editing the “devicelink” CC tables.


Stephen Marsh
 

Attachments

  • kodak-colorflow-icc-input-curves.jpg
    kodak-colorflow-icc-input-curves.jpg
    138.5 KB · Views: 167
Last edited:

PressWise

A 30-day Fix for Managed Chaos

As any print professional knows, printing can be managed chaos. Software that solves multiple problems and provides measurable and monetizable value has a direct impact on the bottom-line.

“We reduced order entry costs by about 40%.” Significant savings in a shop that turns about 500 jobs a month.


Learn how…….

   
Back
Top