You are using an out of date browser. It may not display this or other websites correctly.
You should upgrade or use an alternative browser.
You should upgrade or use an alternative browser.
Canon 6011 fiery calibration question
- Thread starter bill kahny
- Start date
msaeger
Well-known member
What are you using measure the calibration page? Something like an ES2000 / i1 handheld scanner or something inline or something else? I have seen this from using that board that comes with the handheld scanners. I needed to put paper under the calibration sheet it's like it was reading through the sheet and picking up the rough surface of the board.
Last edited:
bill kahny
Well-known member
Xrite i1 pro2, yes hand held. I always have 2 pieces of 100lb coated cover behind the calibration sheet.
ColorMonkey
Well-known member
I remember seeing a similar problem at EFIs old boards. Not sure if this is the same problem but see if this helps at all.
http://fieryforums.efi.com/showthre...ion-Using-the-Default-Profile-assigned-in-CWS
http://fieryforums.efi.com/showthre...ion-Using-the-Default-Profile-assigned-in-CWS
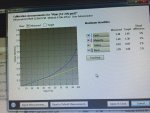
I've never seen measurements that erratic. I always look at the measurements to make sure nothing looks wrong after calibrating, so I've probably seen that screen several hundred times.
The Fiery forum thread referenced by ColorMonkey seems to talk mostly about profile issues, but since the wacky curves are the measurements (rather than the target), I wouldn't think the profile would be to blame.
My guess is something is wrong with the spectrophotometer, or the Fiery's interpretation of its data. The actual raw readings are usually much more erratic than what you see - they get smoothed out by the software, so I'm curious what your raw readings look like. Can you select "Export Measurements..." and post the file?
Are you getting a consistent shape from one calibration to the next? You could try reading the exact same sheet twice by doing two calibrations but using the first sheet when it wants the second one.
I'm surprised there aren't obvious quality problems. I wonder if it's silently rejecting the calibration because there are areas of negative slope (which would mathematically yield multiple outputs for a single input when you try to compensate based on the curve). In the first window that appears when you click "Calibrate," is the date of the last calibration earlier than you would expect?
bill kahny
Well-known member
The date of the last calibration is always correct I try to do it every day. I thought about it being my technique but I don't get miss reads very often, I'm kinda proud of that. I will have my backup operator do it today and see if it changes. Tomorrow I try reading the same print twice to see what kind of reads I get.
Thank you for the suggestions.
Thank you for the suggestions.
ColorMonkey
Well-known member
Hey Bill just curious about the life/condition of your spectro. Grabbing at straws but can you print out a "Spot Color Search" sheet and take several measurements and the readings hold? I mean within a reasonable tolerance of .5-1.0 for each value. Just curious because just maybe the spectro is having issues.
Really hope you get this resolved because that would drive me crazy if I saw that personally.
Also I think if you read the thread I linked, I believe the result was it was a display anomaly on CWS side. I think it was found that the reading just displayed incorrectly because it had issues displaying G7 created profile measurements through CWS. I haven't reread it and may be wrong but I'm pretty sure it was just an issue in the way it was be displayed.
Anyways good luck and if I see anything when I have time I will try to post it.
Take care.
bill kahny
Well-known member
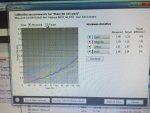
Same cws same spectro, calibrating my c750, as you can see the lines are smooth. btw cws version 5.8.1.100 I think my service company said that's the highest that will support all my hardware?
I got the new spectro with the c750 install less than a year ago. The part that concerns me is the waviness seems to be getting worst. but I don't notice a drop in quality yet.
I got the new spectro with the c750 install less than a year ago. The part that concerns me is the waviness seems to be getting worst. but I don't notice a drop in quality yet.
Attachments
ColorMonkey
Well-known member
Interesting. So have you posted this problem on EFI boards by any chance? https://communities.efi.com/s/topic/0TO39000000EpTlGAK/fiery-color-profiler-suite?language=en_US
I would post it then PM Lou Prestia if you don't get the response you are looking for or one at all. I would give you his direct email but I don't think I can share it so try PM. Maybe you can find it online though.
Yeah that is interesting that you aren't seeing a noticable change in output though that takes me back to the display anomaly I spoke of. I could be talking out of my rear here but I swear that was the final consensus in that thread.
Good luck!
Also if you do get it resolved make sure you post here I would love to find out what is causing that as well.
What Steve0 posted sounded like the most plausible explanation to me, but then you posted your measurements from another machine that look fine. I'm guessing your measurement technique isn't different between the two machines. Though that explanation is probably no longer applicable, keep in mind that just because the measurements validate doesn't mean they're right. If you wobble the instrument a bit or slightly drift over the edge of the patches, it would probably still validate. It's mostly just making sure it can derive a given number of patches from its scan to a certain degree of confidence. If it balked at readings that weren't close to an ideal target then you wouldn't be able to use it for calibrating or profiling devices that weren't close to perfect in their native uncalibrated state.
Is it the same Fiery server or do you have a different one for each machine? One of your screenshots reads "INSTR_GR_EYE2" and the other reads "X-Rite i1 Pro2."
Is it the same Fiery server or do you have a different one for each machine? One of your screenshots reads "INSTR_GR_EYE2" and the other reads "X-Rite i1 Pro2."
bill kahny
Well-known member
Thanks for all the help so far.
They are different servers, one is integrated on the back of the machine (but fiery) g2000 v1.0 and one is a standalone box a1300 v1.0; this has the spectro connected. Its also the one giving me the wavey lines. I never noticed that that the spectro was identified differently for the two machines. I pick it by name as X-Rite i1 Pro2 on both. I use the same technique and random patch print pattern on both.
I've never used the fiery boards but will check them out this week end.
ColorMonkey
Well-known member
Just so no one is wondering, that is the correct device id for the i1 Pro2 on the 6011.
Good luck Bill hope its resolved.
Good luck Bill hope its resolved.
ColorMonkey
Well-known member
So Bill I notice the thread at EFI went cold, did you ever get a straight answer to what caused this and/or did you get it resolved?
bill kahny
Well-known member
Not yet. I am putting in a service call on the 750 and am going to point it out to the service tech again. Since there is no noticeable quality issue with the printouts its not a high priority. A service call for quality last week on the 6010 didn't change the readings but fixxd the uneven color acrost the sheet.
Similar threads
- Replies
- 27
- Views
- 5467
- Replies
- 2
- Views
- 671
- Replies
- 7
- Views
- 1656
- Replies
- 20
- Views
- 4895
InSoft Automation
|
InSoft Automation Unveils Imp Version 14
Revolutionizing Layout Planning and Automation InSoft Automation announces the launch of Imp Version 14, the latest iteration of its industry-leading cost-based layout planning software. Packed with cutting-edge features, this release redefines efficiency, automation, and workflow optimization for printing and finishing processes. Learn more……. |


