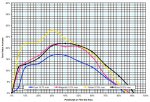
Dot gain grapher

gordo

Well-known member
I'm looking for an Excel spreadsheet (or something else) that takes in either densities or dot gain values and graphs the values. (like the image attached) I've tried the ISODotGain Grapher.xls but, following the instructions seems to give strange results.

Thx, gordo
 

Attachments

  • Dot grain graph.jpg
    Dot grain graph.jpg
    176.6 KB · Views: 194
Hello, gordo,

I recently created something that might fit your description and I will be happy to share it with you. I created this login to reply and have not oriented myself, yet. Sorry. Please let me know a way to transmit the file to you.

Regards,
Frank
 
Hello, gordo,

I recently created something that might fit your description and I will be happy to share it with you. I created this login to reply and have not oriented myself, yet. Sorry. Please let me know a way to transmit the file to you.

Regards,
Frank

Thanks!

Email it to me at pritchardgordon @ gmail (dot) com

Best, gordo
 
I'll be happy to, ar17. I tried to figure out how to send it to you, but I have not found an email address or another mechanism. I'll look, but please feel free to let me know how to reach you.

Regards,
Frank
 
Frank, you can attach the spreadsheet to the forum post as an attachment if you like. If the attachment is not allowed, zip compress it first.


Stephen Marsh
 
OK, gordo. I sent you a couple of spreadsheets. Please don't hesitate to ask for modifications.

Best regards,
Frank

Hi Frank,

I've opened the spreadsheets, however they don't seem to do what I was hoping to do - which is very basic.
I just want to plot the dot gain curves for the 4 process colors. I.e. plug in the dot gain values and have them graphed like this.

Dotgains_zps06768e9b.jpg


Which your spreadsheet doesn't seem to do.
Or maybe I don't know how to use it.

thanks, gordo
 
Hi gordo,

I have emailed you a workbook that has five worksheets. Sheet one, labeled "Dot Gain Curves", reflects my understanding of your request. Sheets 2-5 are there for plotting actual dot values, not gain, against the file dots; one sheet per process color. The final sheet, labeled "Dots Example", is an example of generating a cutback curve. The horizontal black lines are there to aid in counting the correction.

I left the sheets you weren't interested in for others who may find them interesting. To delete sheets you don’t want, right-click on the sheet tab and select "Delete." The tonal values range from 0% to 100%, in increments of 5%. You can delete rows for the tonal values you are not interested in.

Hope we're closer.

Frank
 
The manage attachments window allows for a .zip "container" to upload any file type that is not supported in the standard upload types. For example, a .doc file can be uploaded, wile a .xls file can't be directly uploaded - unless the spreadsheet is ''wrapped" in a .zip file before uploading.


Stephen Marsh
 
Thanks again, Stephen.

I could not see the "Manage Attachements" section until I clicked on "Go Advanced." I believe that I have successfully uploaded the file.

Regards,
Frank
 

Attachments

  • Dot Gain Grapher 2.zip
    14 KB · Views: 194

PressWise

A 30-day Fix for Managed Chaos

As any print professional knows, printing can be managed chaos. Software that solves multiple problems and provides measurable and monetizable value has a direct impact on the bottom-line.

“We reduced order entry costs by about 40%.” Significant savings in a shop that turns about 500 jobs a month.


Learn how…….

   
Back
Top